
An Intern’s-Eye View of the MIC
Bikes, peds…
Did you realize that on just fourteen streets in Duluth and Superior during one 12-hour period in September, there are around 1,240 uses of infrastructure by bicyclists, and 5,896 uses of infrastructure by pedestrians? The entire town I live in (around 900 people) would have to walk back and forth more than six times to get that pedestrian count.
I am going to guess that your answer is no, you had no idea the extent of the infrastructure used by alternative transportation in Duluth and Superior.
I’m also guessing that most of you also don’t know the extent of the effort that goes into this 5×19-cell table.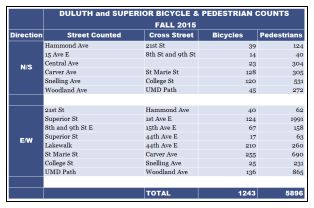
This is the fourth year of the biannual bicycle and pedestrian counts. James Gittemeier, senior planner at the MIC, and Shawna Mullen-Eardley of the Healthy Duluth Area Coalition determine count data sites, recruit and coordinate volunteers, and lead volunteer training. After attending training, each volunteer* is asked to sit for two hours at a count site and fill out a form noting direction of travel, users by demographic (male, female, child, using assistive device), and mode of transportation (walking, biking, “other”). (The method for the count was created by the National Bicycle and Pedestrian Documentation Project).
Are you getting a better idea of what goes into this seemingly simple chart?
After the day is over and all of the forms are gathered, the amazingly talented and intelligent intern (hey that’s me!) gets to decipher the notes of dozens of volunteers. The data gets entered into Excel by 15 minute increments for each demographic and each mode of transportation. Lucky for me, there is already an Excel spreadsheet that is set up to create the totals. I then finagle Excel to make those totals magically appear into this chart.
Don’t think this chart is the final product, either! After the data is entered and the totals are gathered, we begin an analysis of how the trends in the data will have an effect on future decision making for alternative transportation infrastructure. Excel is very useful in the analysis portion. So far I’ve created around 50 charts to get a better idea of visible trends.
Although I will concede that the data is not perfect – human error in counting and entering the data – the numbers tell an interesting story: The people of Duluth and Superior are outside and active.
*A huge thank you to all volunteers whether you did more than asked or did just as much as you could
…and buses (oh my!)
I can’t talk about all the time I’ve spent in Excel the last two weeks without also bringing buses into the mix.
Robert Herling, my supervisor and another senior planner at the MIC, has been researching the infrastructure use in the Lincoln Park for the Multi-modal Study that’s underway for that neighborhood.
One important aspect of this research is looking into the use of public transit.
Have you ever had to transfer between two city buses to find that either the last one left just minutes prior to your arrival, or you have less than five minutes to get to the bus stop on the other side of an intersection? You should try it some time.
Robert tasked me with finding out how often this occurs for a few of the major transfers in the Lincoln Park area, from the mainline at 21st Ave W and Superior Street to the mall lines, as well as the mainline at Superior Street and Garfield to the Superior, Wisconsin line. A misstep in scheduling is not a rare occurrence for these bus users, but don’t fret! Our loyal transit authorities are not overlooking this issue.
Thanks for taking the time to join me on my journey to find out what the MIC is all about. Now I must get back to my spreadsheets.